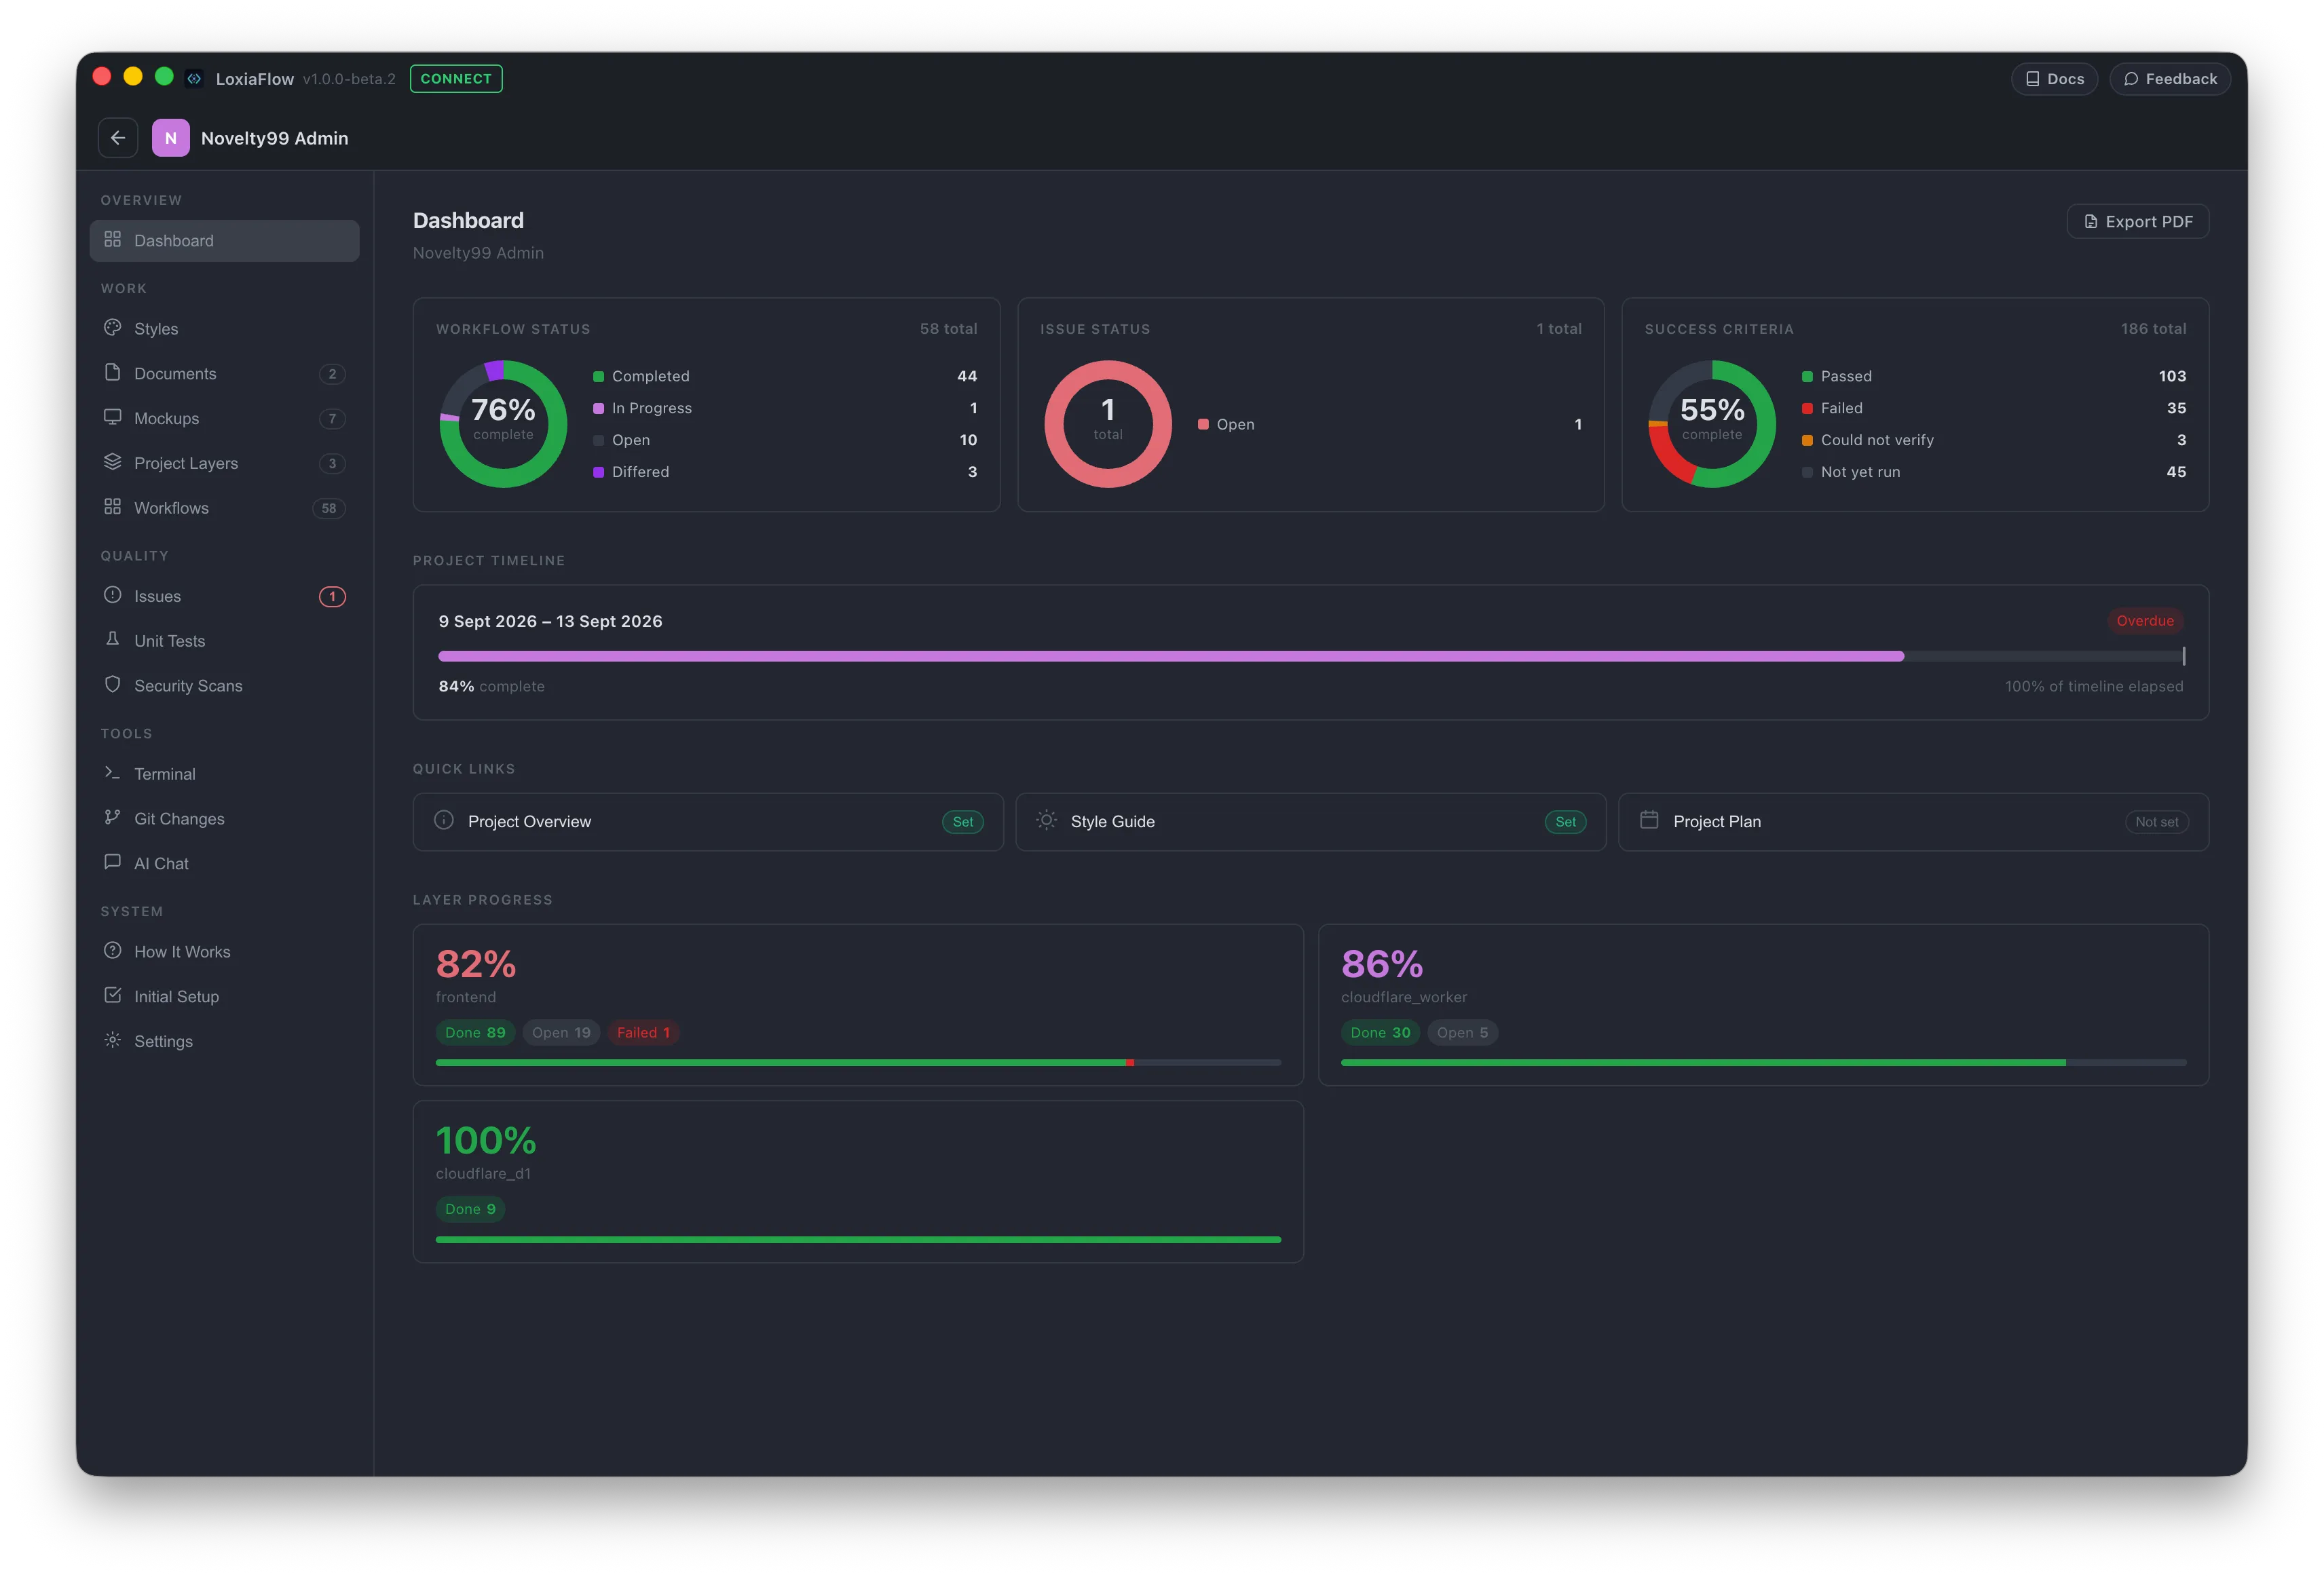
The project's dashboard — a single-screen rollup of workflow completion, open issues, timeline progress, and layer status, so you can see where the project actually stands without digging through every page.
Stats row
Three ring-chart cards, rendered as inline SVG (no charting library):
- Workflow Status — Completed / In Progress / Open / Differed, center shows % complete.
- Issue Status — Open / In Progress / Resolved, center shows total issue count.
- Success Criteria — Completed / Remaining across every workflow's checklist, center shows % complete.
Project timeline
If the project has a Start/End Date (set from the Launcher), a progress bar compares two percentages: how much work is actually done (aggregated executed/total across all layers) versus how much of the calendar timeline has elapsed. A status pill reads Not Started, On Track, Behind Schedule, Overdue, or Completed based on that comparison. Without dates set, this card shows an empty-state prompting you to add them.
Quick links
Two cards jump straight to commonly-needed pages: Project Overview (opens the Documents page, scrolled to a document literally titled "Project Overview" if one exists) and Style Guide (badge reads "Set" once the project has any light/dark design tokens defined).
Layer progress
One card per Project Layer, showing a big percentage (executed/total workflow units in that layer) and a segmented bar split into Executed / Running / Review / Failed / Open. A layer with no workflow units yet shows "—" and a flat gray bar.
Export PDF
The Export PDF button in the top-right builds a standalone, print-styled copy of the dashboard (same stats/timeline/layer cards) and saves it via a native file dialog, named {Project Name} Dashboard {timestamp}.