Runs real, industry-standard scanners against your project — dependency vulnerabilities, insecure code patterns, and hardcoded secrets — auto-detecting the right tool for each layer's stack, with results streamed live and parsed into a severity breakdown.
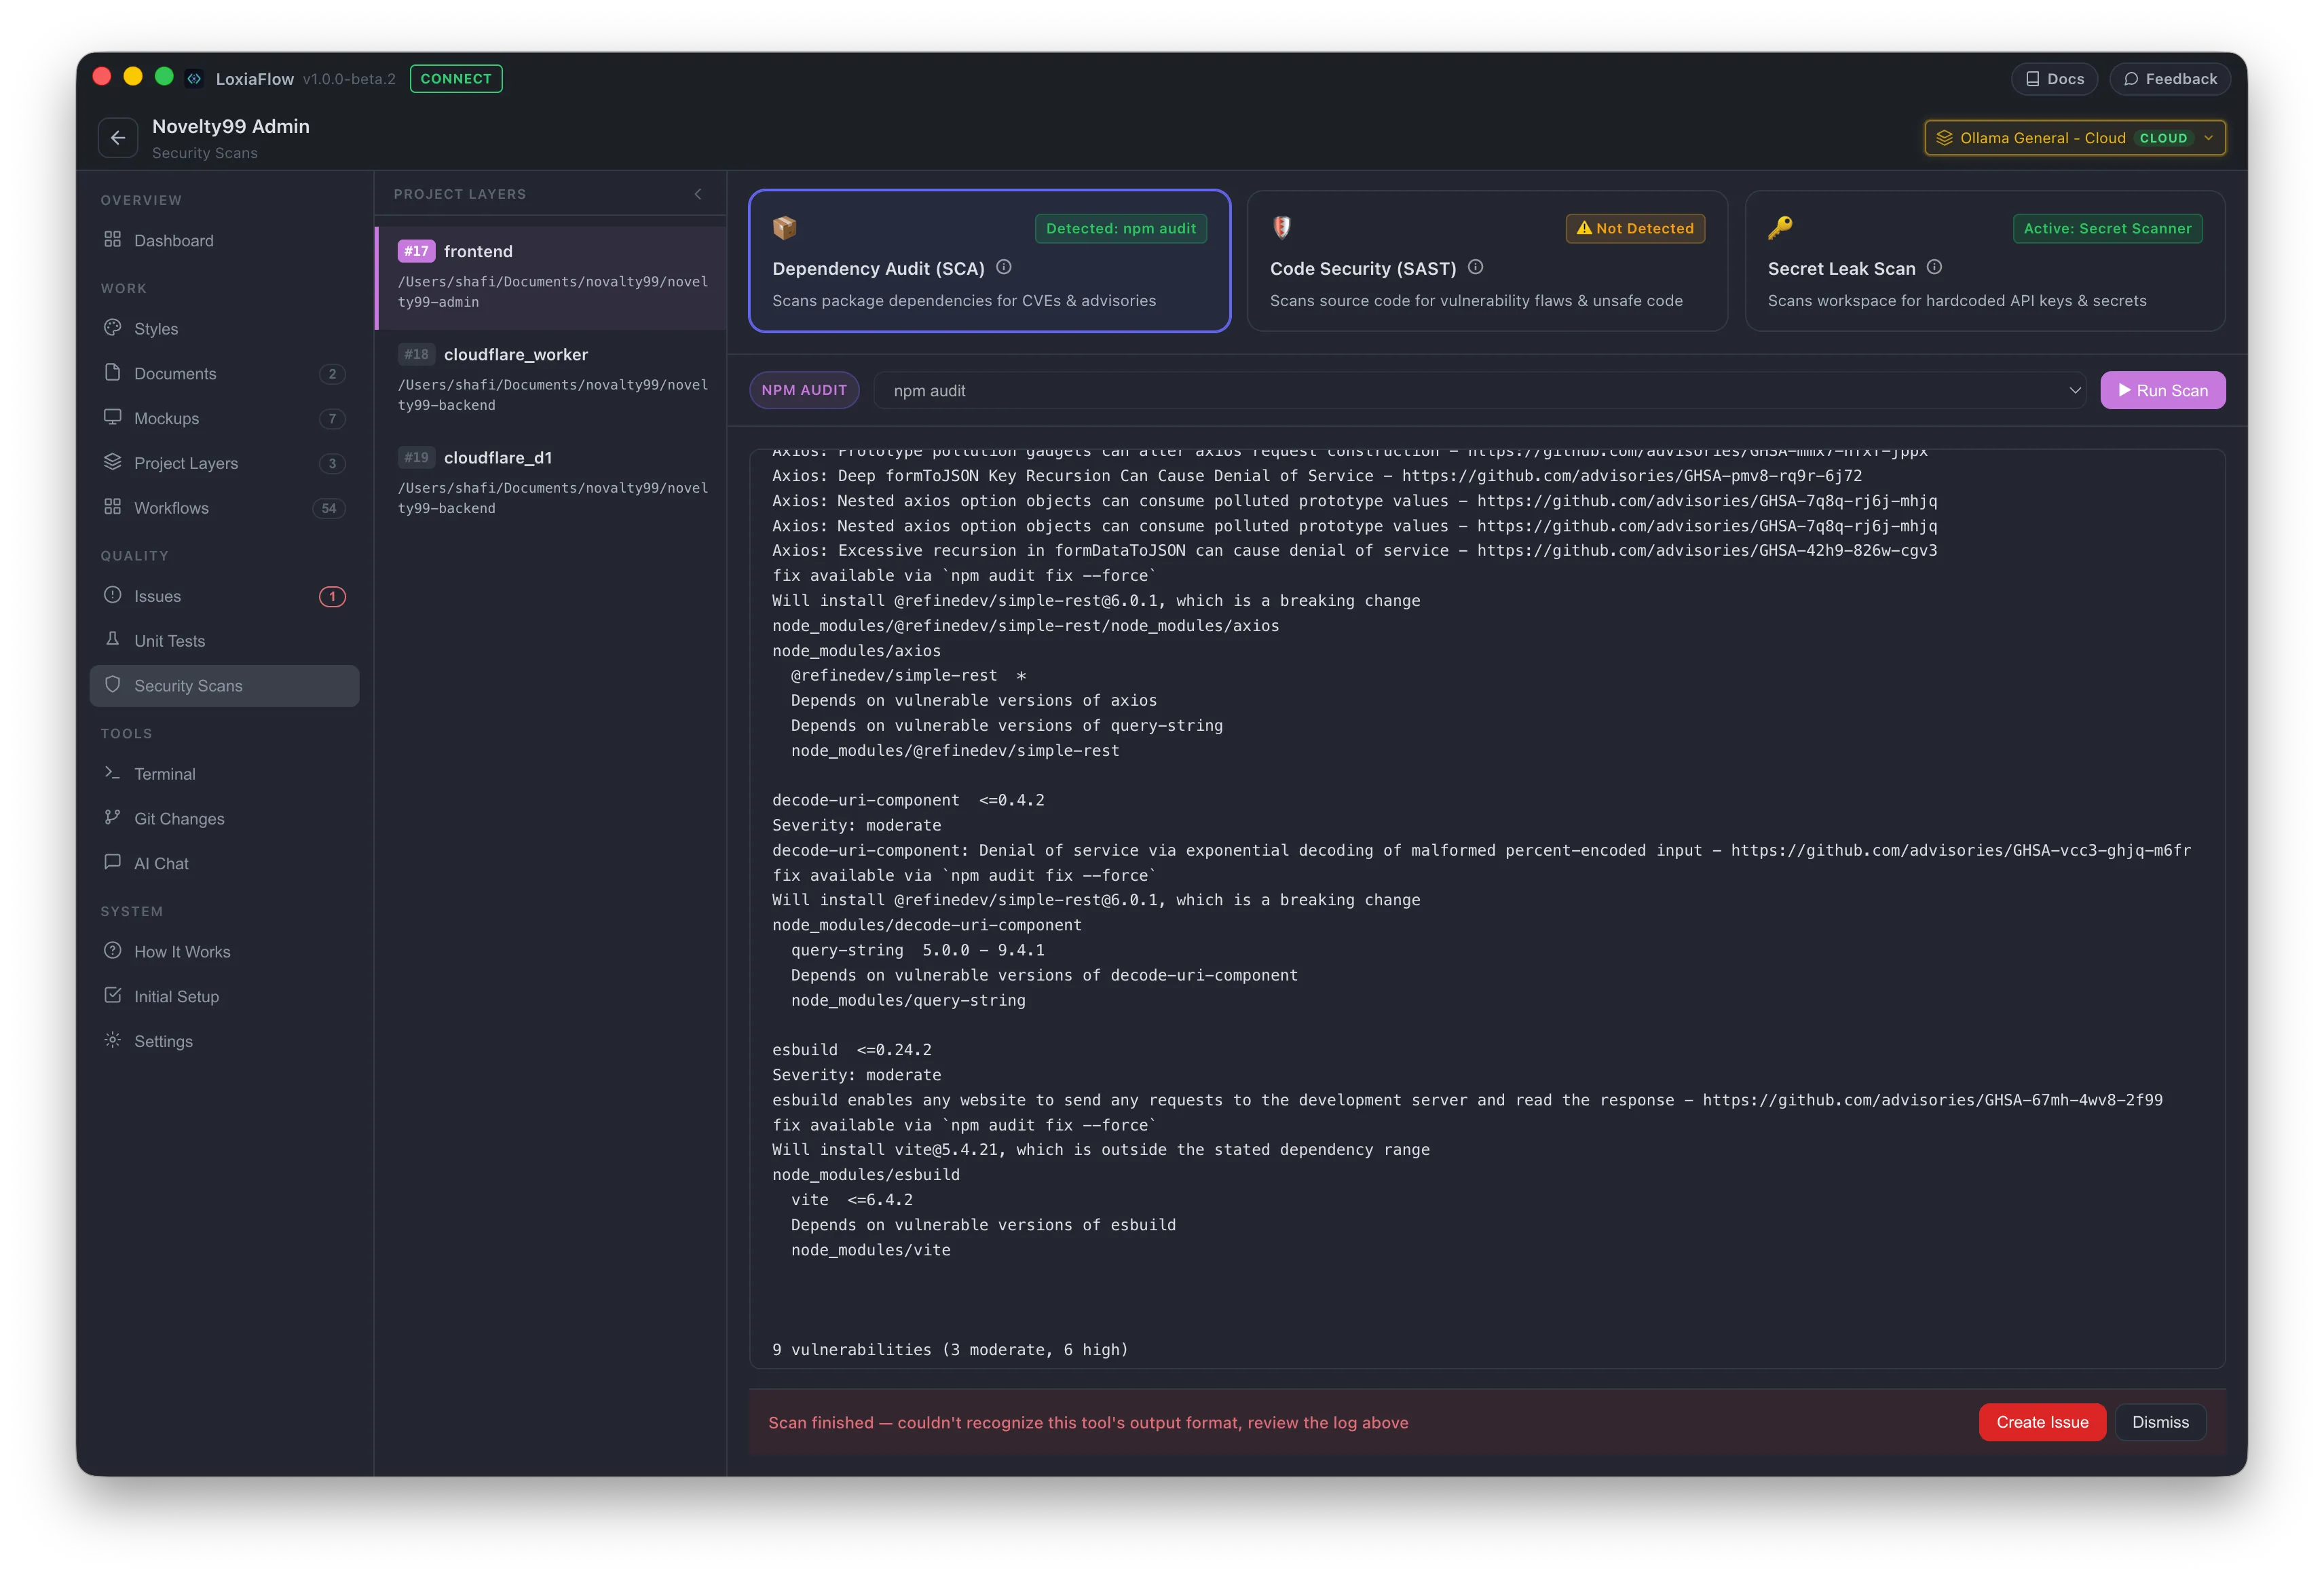
Three scan categories
Each project layer gets three independently auto-detected scan categories, switchable via cards at the top of the page:
- Dependency Audit (SCA) — audits package manifests for known CVEs. Tool per stack: npm audit (+ Snyk if it's a dependency) for Node, pip-audit / Safety for Python, govulncheck for Go, bundler-audit for Ruby, dart pub audit for Flutter, dotnet list package --vulnerable for .NET, and OWASP Dependency-Check for Maven/Gradle.
- Code Security (SAST) — inspects source code for security flaws and unsafe APIs. Tool per stack: Semgrep (
p/security-auditruleset) or the ESLint security plugin for Node, Bandit for Python, gosec for Go, Brakeman for Ruby, dart analyze for Flutter, and Semgrep for .NET/Java. - Secret Leak Scan — scans the workspace line-by-line for hardcoded credentials. This is a built-in regex scanner that runs in the main process by default (no external tool required), detecting AWS access keys, OpenAI/Groq API keys, GitHub tokens, PEM private keys, and generic hardcoded password/secret assignments — each tagged critical or high. gitleaks is offered as an alternative only when it's already a project dependency or a
.gitleaks.tomlfile exists.
If nothing is auto-detected for a category, an install guide for the suggested tool is shown, and a manual command box lets you type your own scan command instead.
Running a scan
Scans run one project layer at a time. Pick a command from the dropdown, click ▶ Run Scan, and watch live streamed output (ANSI codes stripped, progress-bar redraws collapsed) with an elapsed-time indicator and a Stop button. Results are parsed per tool into a critical / high / medium / low breakdown where the tool's output supports it.
After a scan
A result banner summarizes findings and offers Create Issue. If an AI model is configured for this page, the scan output is sent to it first to generate a structured, one-line-per-finding breakdown with suggested fixes (falling back to the raw output if the AI call fails); the created issue's severity is set from the worst bucket found. Every scan is saved to per-project Scan History, which retains the last 20 scans.